Ok so you've gone out and performed SWOT now what?
Assuming you want impact in your recommendation to your client, using the following approach with your SWOT will give your recommendations credibility. Keeping in mind that a SWOT is both internally and externally focused, by following these steps, your proposal will more accurately quantify the thoughts and concerns of your client.
Assuming you want impact in your recommendation to your client, using the following approach with your SWOT will give your recommendations credibility. Keeping in mind that a SWOT is both internally and externally focused, by following these steps, your proposal will more accurately quantify the thoughts and concerns of your client.
Opportunity and Threats
In order to identify the Threats and Opportunities of a project risk analysis tools from the Project Management Institute can be used. PMI has identified, within the text “Project Management Book of Knowledge, Fourth edition”, two(2) risk analysis tools that can be used to identify the most relevant threats and opportunities: Impact Perspective and Impact Matrix.
Impact Scale
The Impact Scale is a five point chart that can be used to assign a weighted average to various metrics, resulting in a value representative of the impact to an organization. I have altered the metric from the Project Management Institute’s definition, seen below,

- Monetary Value - will be measured in terms of increased revenue (opportunity) or cost (threat) to the organization.
- Time - metric is in reference the time savings enjoyed as a result of exploiting a opportunity or as a result of addressing a threat.
- Market Exposure - they provide to the organization, as a means to strengthen the brand while a threat will be examined for negative impact.
- Process Efficiencies - has been identified as those opportunities that provide improvements, while threats are those that decrease efficiency.
- Relevance - that refers to the overall impact on business strategy and/or processes.
For each identified opportunity and threat, the formula used to determine the impact scale will be as follows:
Probability and Impact Matrix
For each specified opportunity and threat, a thorough analysis of each item will identify a probability of occurrence. In conjunction with the Impact Scale value, the probability will assist in ranking the opportunity or threat. The rank value is calculated with the following formula:

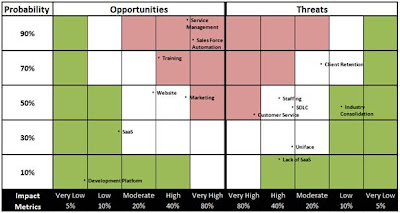
This Probability and Impact Ranking will then be used to plot the opportunities and threats on a Probability and Impact Matrix. The matrix will highlight three sections: high impact areas (red upper center area), moderate impact (white middle sections) and the low impact (green outlier sections). Once each item is plotted, recommendations will, dependant on resources available, focus on items in the high and medium impact areas as to ensure a highly focused solution to the opportunities and threats the immediately faced by the organization.

Opportunities and Threats:
For each opportunity and threat listed in the SWOT, the probability and Impact are taken into account and if you employ weightings based on who provided the response, those are calculated at this point. Once summarized, they are plotted on the Probability and Impact Matrix to determine a 'Score'. This score essentially will assist in plotting the items onto the matrix.
In utilizing the Impact scale's five metrics to provide a structured analysis, each of the opportunities and threats are analyzed and plotted. Each item is measured against the same criteria, thus providing a universal scale that we used to devise a ranking. The weighted Impact Scale value was then multiplied by the probability of the threat, or opportunity occurring, which resulted in the Probability and Impact Ranking for threats and for opportunities. Sample rankings have been plotted in the image below:

The ROI
The Probability Impact Matrix provides a structured means to perform qualitative analysis. The items identified within the matrix are ranked in order of impact (very low, low, moderate, high and very high) and probability of occurring. By plotting each item on the Probability Impact Matrix, we can quickly identify which items are classified as: high impact, moderate impact and the low impact.
I hope this helps and not hinders.
-Project: ROI
